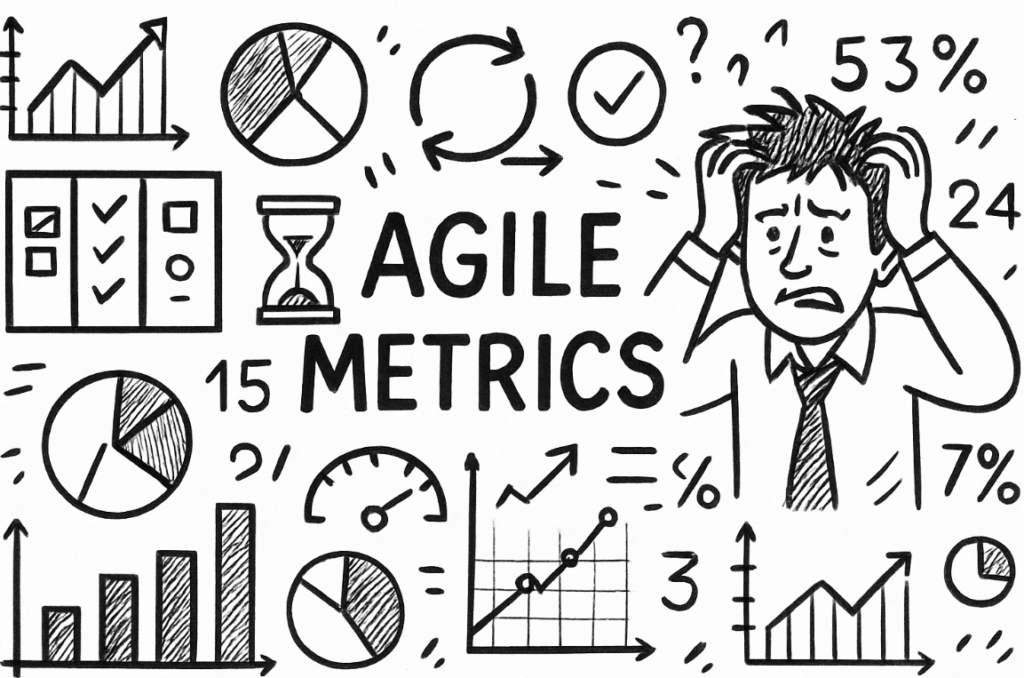
Why Chasing Velocity is a Dead End
I was leading a team at a fintech project in 2015, and management’s new focus was on velocity. Our graphs points in only upwards direction. Every sprint planning session started with a pep talk about “crushing last sprint’s numbers.” Except…our testers were burned out, technical debt was piling up, and nobody remembers why half the user stories matter. At one point, we doubled velocity, on paper, by assigning inflated story points, leaving defects untracked, and rushing QA. This all looked good until a lot of customer complaints nearly chocked the bandwidth. The analysis? We had focused on the wrong metric, ignoring crucial signals like defect rates and actual business value delivered.
That debacle sent me on a warpath to find smarter metrics, ones that actually tell us if team is headed somewhere good, or just spinning their wheels and reporting big numbers to look busy.
Beyond the Scoreboard – What to Track NOW
Agile teams need more than just a scoreboard. Real business agility requires focusing on what actually matters: collaboration, productivity, innovation, and value delivered. Here’s what companies winning with Agile keep a close eye on:
Utilization – Not Just Busywork
Being busy isn’t the same as being productive. Utilization is measured as how much time is actually spent on value-creation activities versus meetings and discussions. Atlassian recommends tracking work-in-progress (WIP) and cycle time to spot bottlenecks, are engineers coding or waiting for clarification? Leading teams have started using automated dashboards that show real utilization, not just hours logged.
Practical tip: Measure and control WIP on dashboards. Its noticed that a 30% improvement in delivery time by limiting concurrent projects and concentrating effort where it counted.
Defect Flow – The Hidden Drain
If you only track story points, defects can quietly hinder your team’s progress and reputation. Defect removal efficiency prevents a product from sinking under its own bugs. I suggest rolling up defect flow into a weekly dashboard, breaking down defects by origin and cycle time.
Quick win: Set a baseline for accepted defect ratio and dedicate a part of the sprint capacity to technical debt. One client noticed a 50% drop in support calls after prioritizing defect reduction over speed.
Value Delivery – The Real Measure
Ultimately, business success comes down to value delivered, not how fast features get pushed or how many stories close. This means tracking business value alongside delivery metrics. Net promoter score (NPS), customer satisfaction, and actual adoption by users. Research shows that more than 50% of Agile leaders measure success by customer satisfaction and time-to-market rather than only velocity.
Real-life story: A retail client used OKRs to align teams around increasing mobile app sales, rather than “shipping X features.” By measuring value delivered each sprint, they increased orders by 35% over six months.
Impact Stories: Real Teams, Real Business Wins
- Spotify: By tracking release frequency and user engagement, Spotify’s Agile squads manage to balance rapid deployment with high product quality, iterating based on feedback loops instead of chasing arbitrary velocity targets.
- ING Bank: Post-Agile transformation, ING adopted flow efficiency and time-to-market as guiding metrics, shortening product delivery cycles and launching new digital banking features on record timelines—while defect rates dropped substantially.
- Airbnb: Happiness scores and customer satisfaction ratings are front-and-center. A shift from pure velocity to a blend of value delivery and team morale helped them innovate faster and retain top talent.
Research shows organizations that track business-driven Agile metrics see improved collaboration, sharper productivity, and genuine innovation that translates to the bottom line.
Screenshots: Dashboards That Make Metrics Work
Agile dashboards have gotten smart. A good one features:
- Simple burndown charts for sprint progress
- Cumulative flow diagrams for work-in-progress tracking
- Defect flow bars showing origin, fix time, and impact
- Business value track—OKRs, NPS, sales figures mapped against features shipped
If you want some visual inspiration, check your platform where dashboard templates are available that show more than just velocity curves. A dashboard that puts customer satisfaction alongside release frequency and defect ratio is worth more as it spotlights trends and spark meaningful conversations.
Step-by-Step Advice: How to Select and Use Smarter Metrics
- Anchor Metrics to Business Goals: Don’t chase numbers for numbers’ sake—work with leadership to align every metric with a real business outcome (revenue, retention, user growth).
- Limit Metrics to a Memorable Few: Two to five, max, for your team and product. Focus breeds clarity.
- Educate Your Stakeholders: Explain what each metric means, why it matters, and how it’ll improve outcomes.
- Automate Collection and Display: Use Jira, ClickUp, or Aha to routinely show metric trends, eliminating manual reporting.
- Make It Visual: Post dashboards everywhere—team rooms, company-wide Slack channels, emails, retros.
- Set Baselines and Targets: Know your current state; use quarterly targets to spur improvement.
- Review, Reflect, Revise: Use retrospectives to dig into what moved the needle and what didn’t. Adjust as needed—metrics should evolve, not stagnate.
- Be Transparent: Metrics mustn’t be used as a stick—they’re for learning and improvement, not policing.
- Experiment: Try new metrics, sunset old ones, swap dashboards. Never stop learning.
Fostering Innovation, Productivity, and Collaboration
Metrics can and should spark innovation—not kill it. Airbnb’s focus on happiness scores led to fresh brainstorms and retention. ING’s attention to time-to-market sped up new idea launches. Spotify’s use of engagement metrics multiplied creativity in playlist features. When teams connect what they measure to customer delight and employee engagement, innovation isn’t just a buzzword—it becomes daily practice.
Productivity doesn’t live in a vacuum. When you measure what matters (think defect flow plus cycle time plus value delivered), teams finally get to spend their energy building cool stuff instead of just reporting on it.
Collaboration shines when metrics are shared transparently and everyone gets the story behind the numbers. One insurance client posted NPS and team happiness scores on their scrum boards; this killed the old silo mentality and led to open discussions that changed how people collaborated for the better.
Anecdotes & Lessons Learned
Back at the fintech project, switching our focus from velocity to a trio of metrics—defect ratio, flow efficiency, and business value delivered—was a gamechanger. Within two quarters, customer complaints dropped, team morale rose, and execs finally understood what was driving improvement. Turns out, transparency beats number games every time.
Join the Conversation!
That’s my experience. Now, let’s hear yours. What’s the weirdest Agile metric you or your teams have tracked? What surprised you the most—what unlocked real business value or made everyone laugh at retro? Drop your stories, screenshots, or gut-feel metrics.
References & Further Reading:
PremierAgile, “Agile KPIs: How to Measure Agile Success”
John Doerr, “Measure What Matters”
Mike Cohn, “Agile Estimating and Planning”
Christopher Davis, “Agile Metrics in Action”
Polaris Solutions, “The Little Book of Agile Metrics”
Atlassian, “Five Agile KPI Metrics You Won’t Hate”